
.jpg)
UTAR Faculty of Accountancy and
Management (FAM) organised a webinar titled "Impact of Major
Infrastructure on Residential Property Markets: Melbourne Airport Case
Study" on 24 February 2021 via Microsoft Teams with the attendance of 112
participants.
The invited speaker was UTAR
Bachelor of Building and Property Management (BBP) (Honours) external
examiner Prof Dr Alfred Christopher Eves. He is the associate dean for
Research and Innovation of School of Property of Construction and Project
Management at RMIT University. Moderating the webinar was FAM Head of
Building and Property Management Department Low Chin Kian.
Prof Alfred is the
external examiner for UTAR Bachelor of Building and Property Management
(Honours)
After Low initiated the talk, Prof
Alfred took the virtual stage and introduced the background of the Melbourne
Airport Case Study, “My interest stemmed from a project I initially started
in 2013 as I was approached by Brisbane Airport Corporation when I was in
Queensland University of Technology, Australia. They were actually planning
to put in a second runway with a parallel runway system.”
He highlighted, “The Brisbane
Airport Corporation realised that some of the public was going to be quite
negative about the new runway, therefore they wanted to know what would be
the possible impact when the new flight paths come in. When people talk
about major infrastructure programme, like the new development of railway,
airport and etc, one concern is about the impact of house prices. Therefore,
I started the case study by analysing the performance of a range of suburbs
across Brisbane, the movements in the median and average house prices and
the subsequent investment performance relative to the location of the flight
paths and the potential aircraft noise from 1988 to 2019.”
Prof Alfred explained, “When we
talk about the impact of major infrastructure, it is usually the impact of
noises that people are concerned about, for example, the increase of
movement, noise pollutions and so on, but what people really concerned about
is its impact to their property; their housing prices. However, based on the
result of my study, there were different views on how people react to
noises. Fifty per cent of people gave positive comments, despite living
under the flight path with aircraft noises as they think it consumes less
time when commuting to work. Furthermore, some of the respondents feel
positive about aircraft development as it will lead to a more quality
housing development and there will be no high rise property or retail
development at the surrounding.”
He continued the discussion by
highlighting his research focus, giving seven comparisons. He compared
suburbs with reported noise complaints versus suburbs with no or minimal
noise complaints; suburbs located under the N70 24-hour noise contour versus
suburbs adjoining the N70 24-hour noise contour; lower value noise complaint
suburbs versus lower value no complaint suburbs; middle value noise
complaint suburbs versus middle value no complaint suburbs; higher value
noise complaint suburbs versus higher value no complaint suburbs; individual
suburb capital return and investment performance from 1990 to 2019 and
lastly the impact of development overlay and residential property
performance.
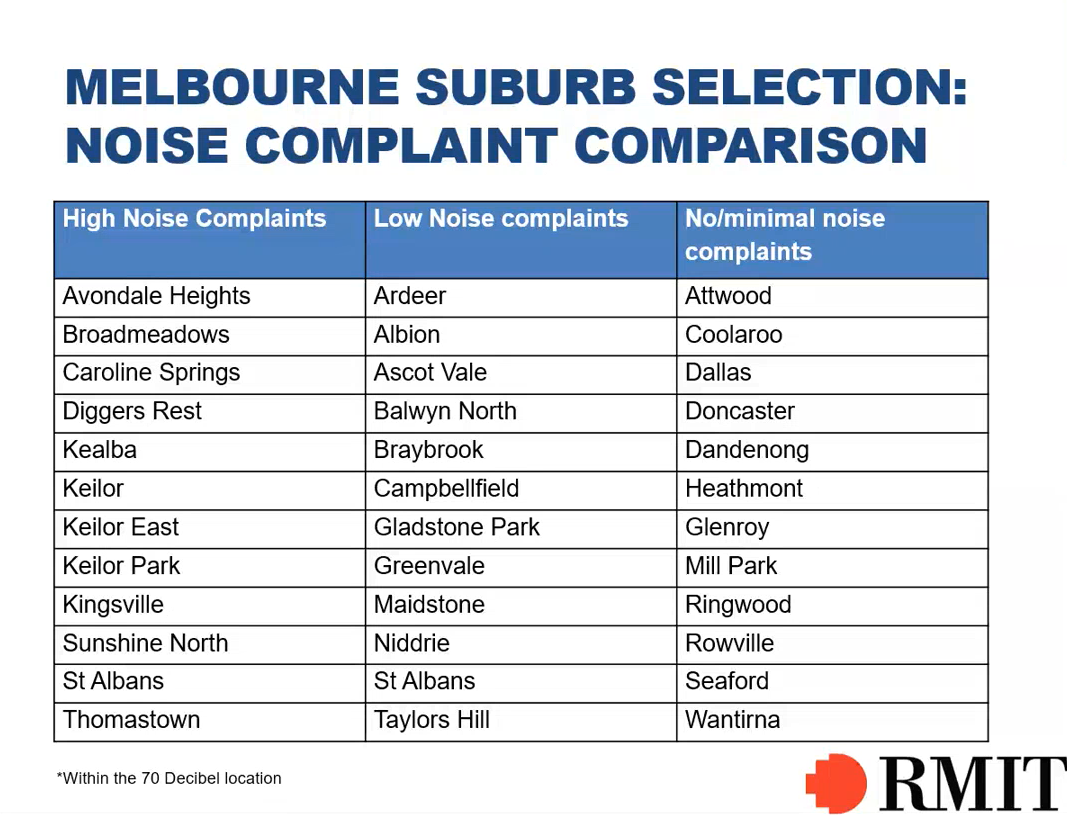
Prof Alfred showing
the suburb selection and comparing it with high reported noise complaints,
low noise complaints and no or minimal noise complaints
According to Prof Alfred, he had
chosen 36 suburbs to make the comparison. All the data he gathered on noise
complaints are from Airservices Australia. He identified it with three
categories, namely high noise complaints, low noise complaints and
no/minimal noise complaints. For the high noise complaints category, there
were six or more complaints on monthly basis; the low noise complaints
category consists of two to three per month and there are no complaints or
occasionally one per month for no/minimal noise complaints category.
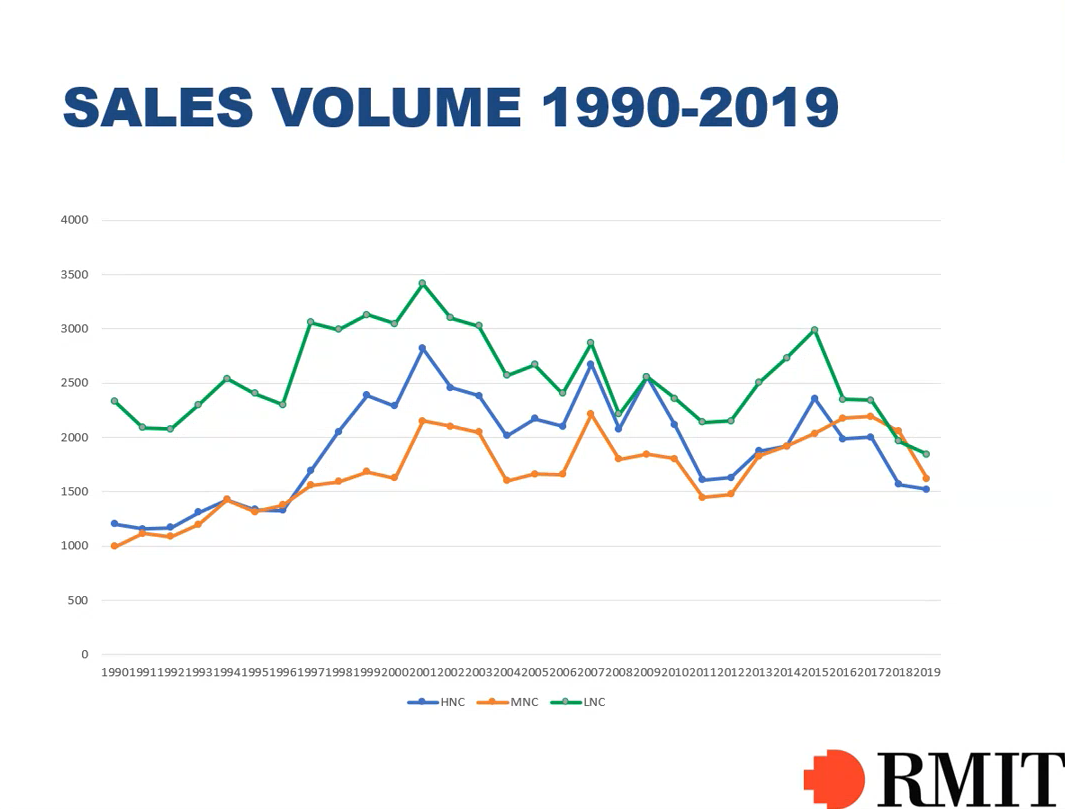
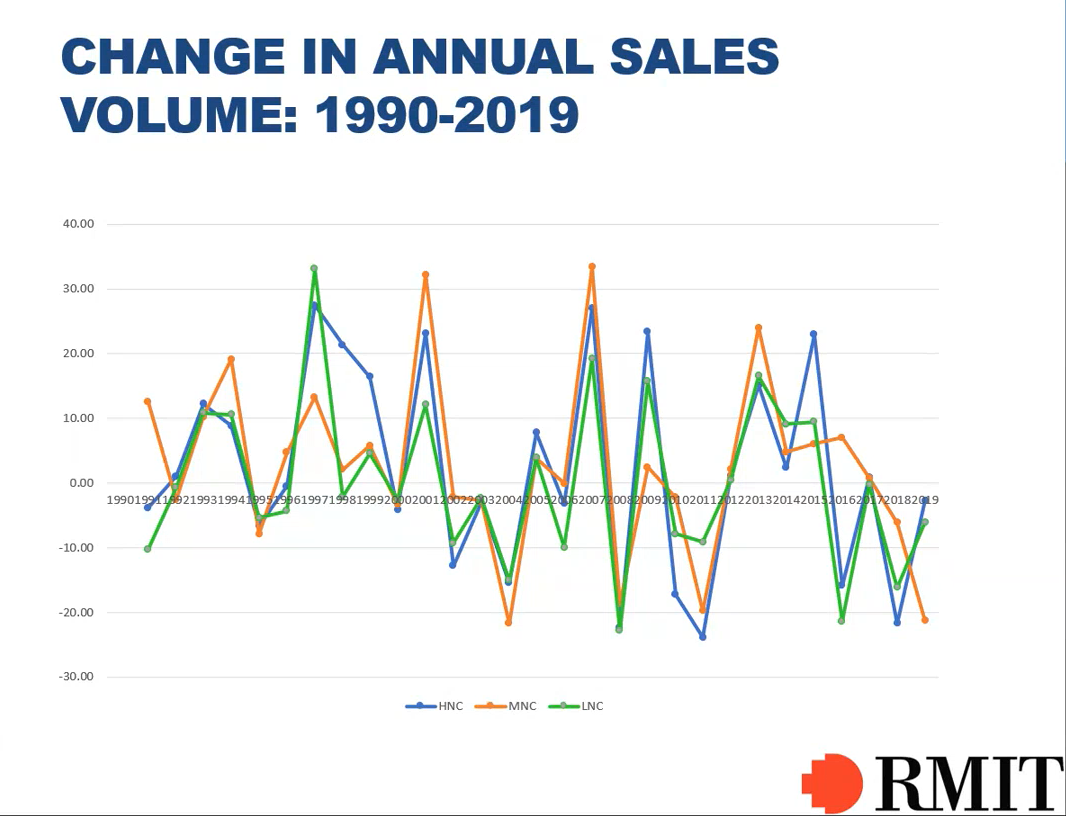
The graphs showing
the comparison of sales volume of low noise complaint location, moderate
noise complaint location and high noise complaint location (left) and also
the changes in annual sales volume (right) from 1990 to 2019
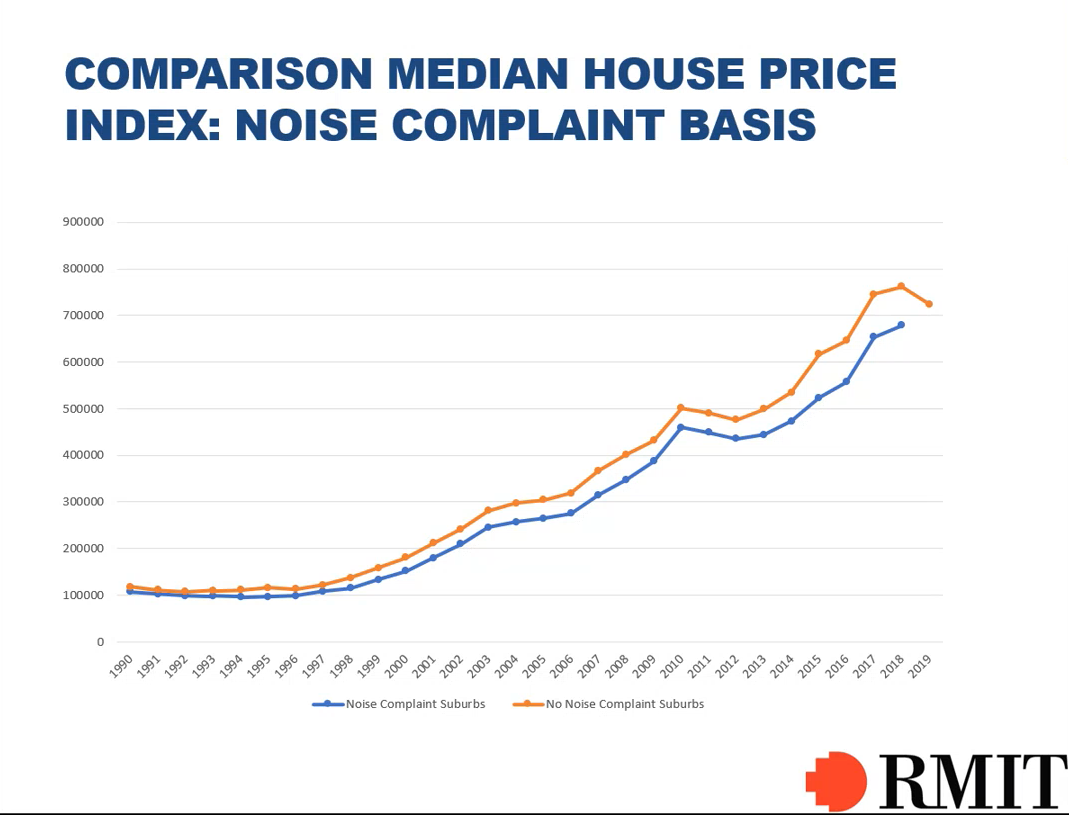
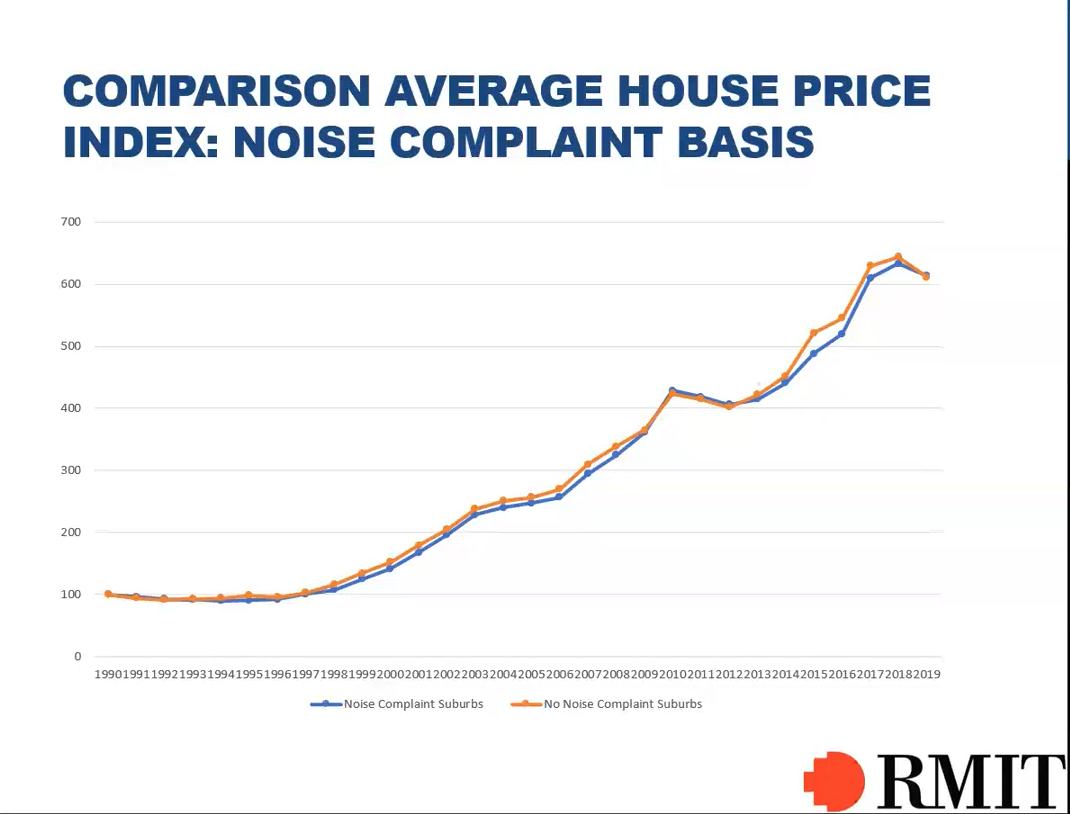
Graph showing the
comparison of investment performance on median house price index and average
house price index on noise complaint suburbs and no noise complaint suburbs
Prof Alfred described, “Looking at
the graph on the investment performance of median house price index on noise
complaint suburb and no noise complaint suburb, the trend of house price
movement is quite similar and does not see any significant drive that
impacts the performance of the particular market. There are only minor
differences shown especially in the average house price index.”
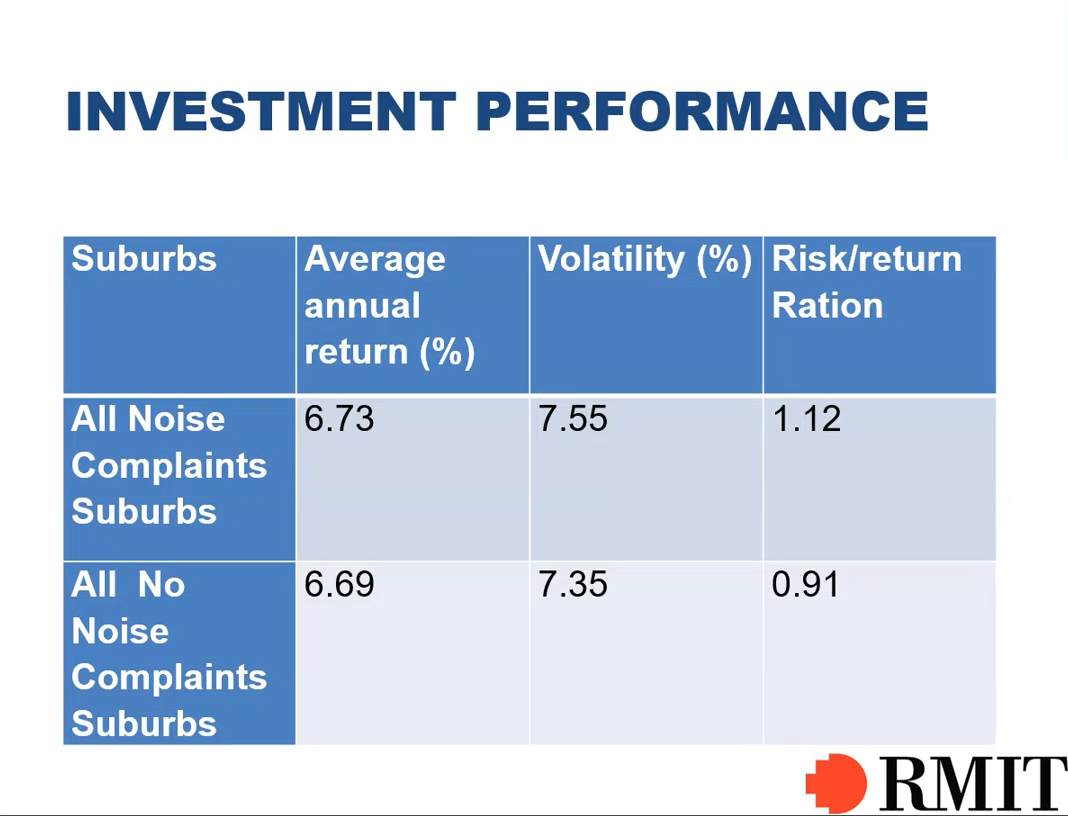
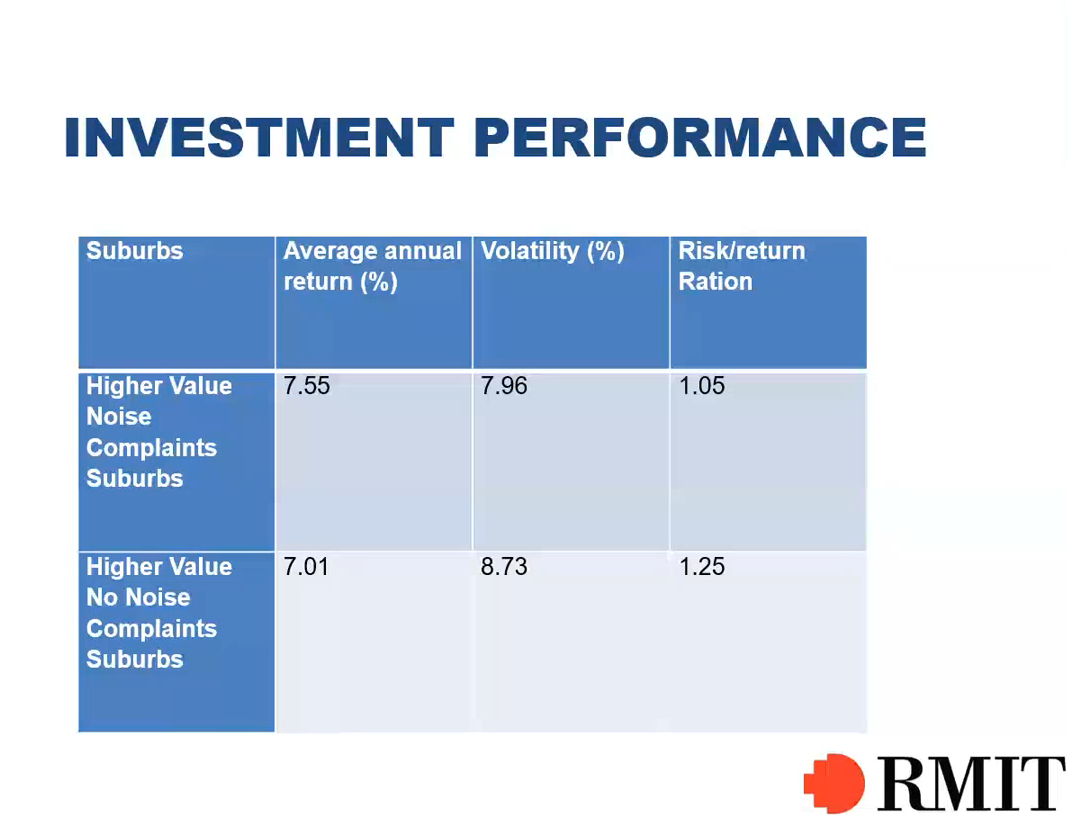
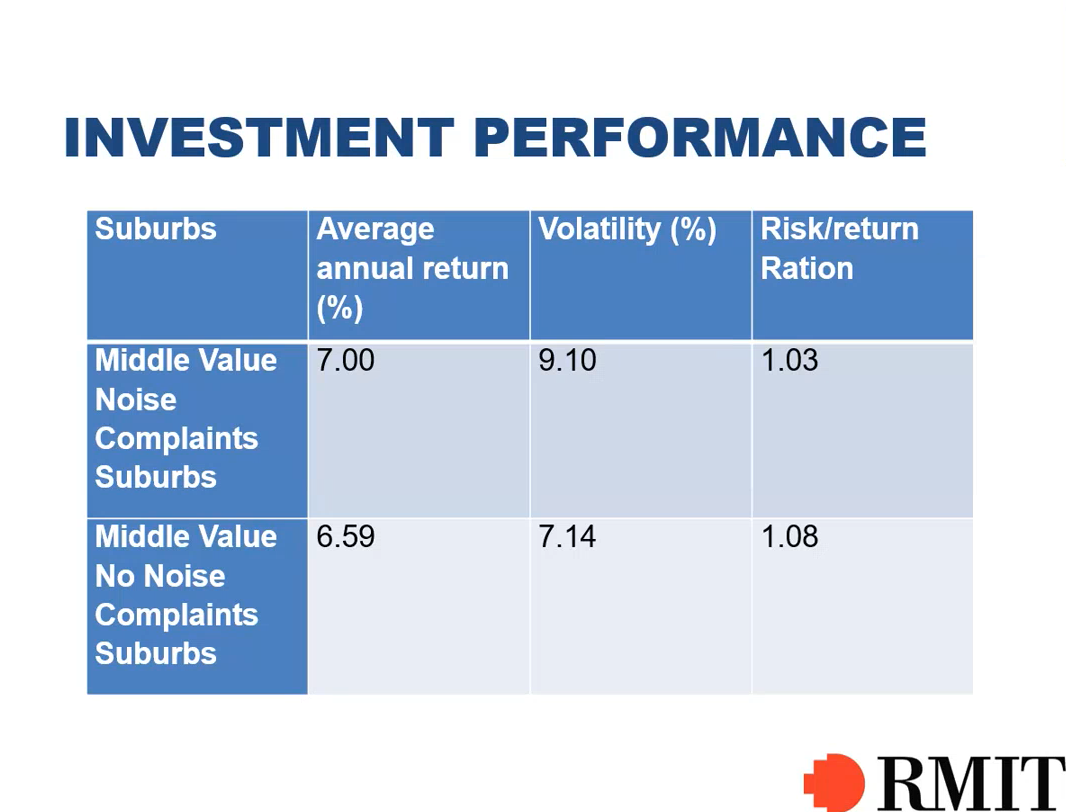
The average annual return of all noise complaint suburbs are higher than all no noise complaint suburbs
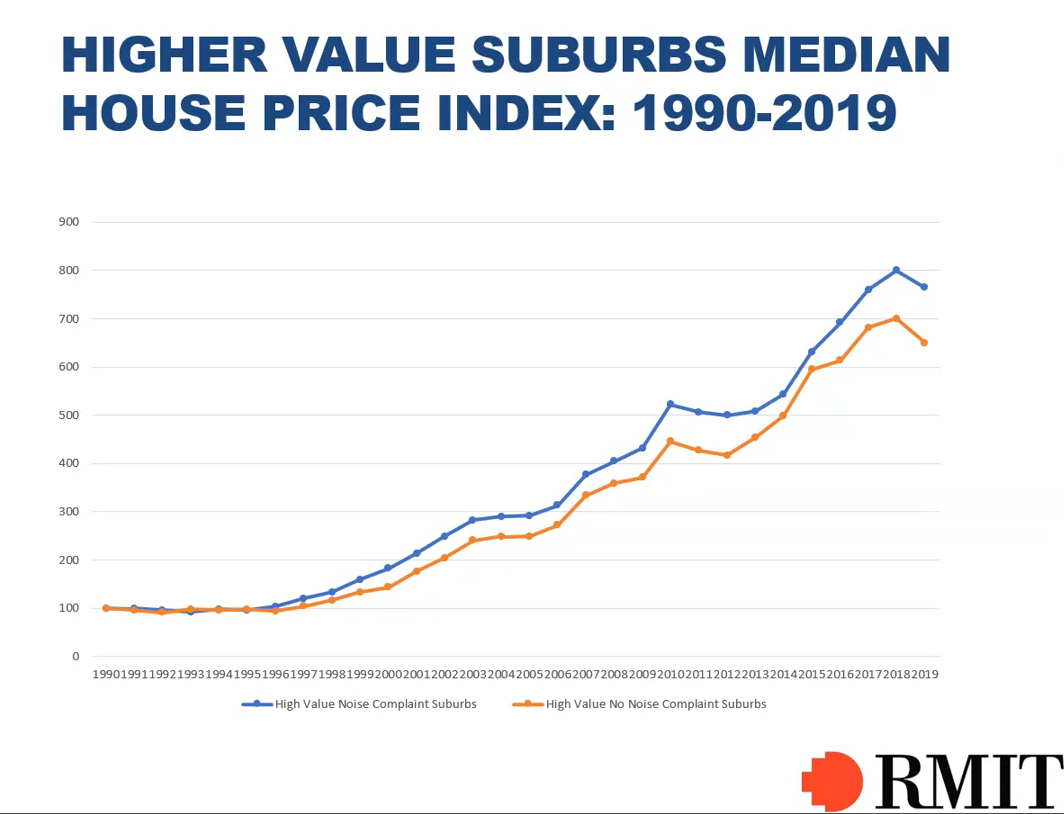
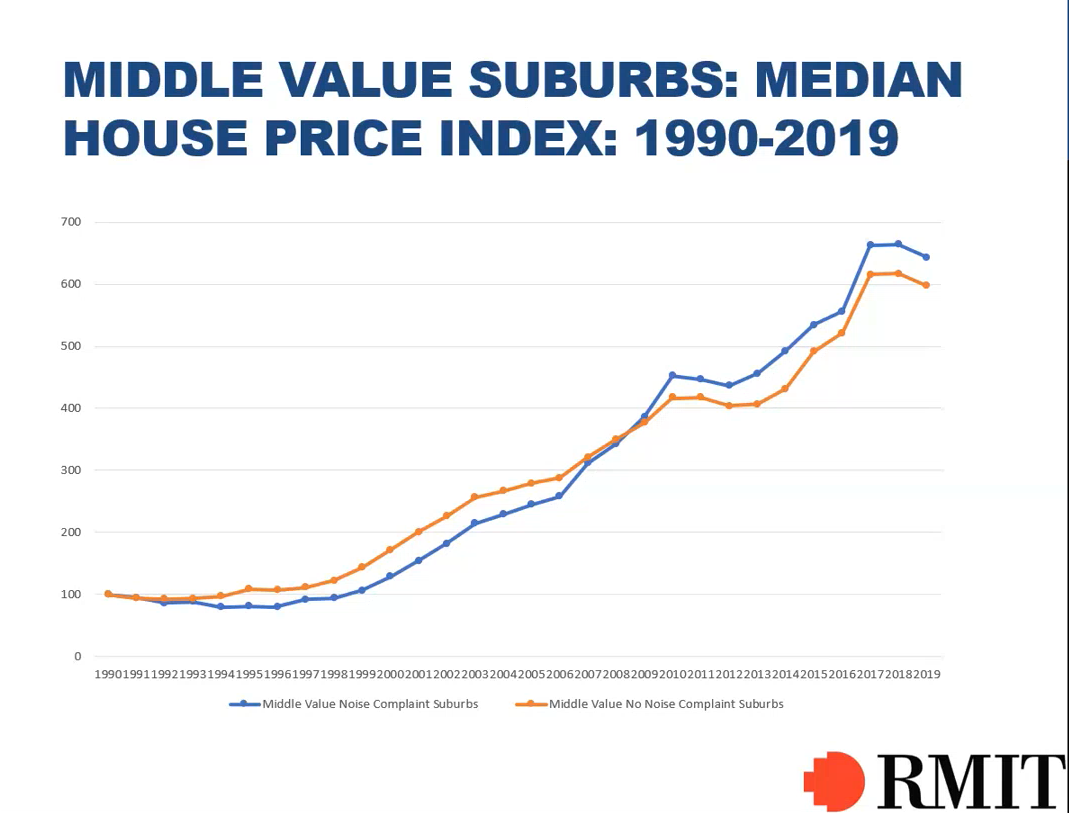
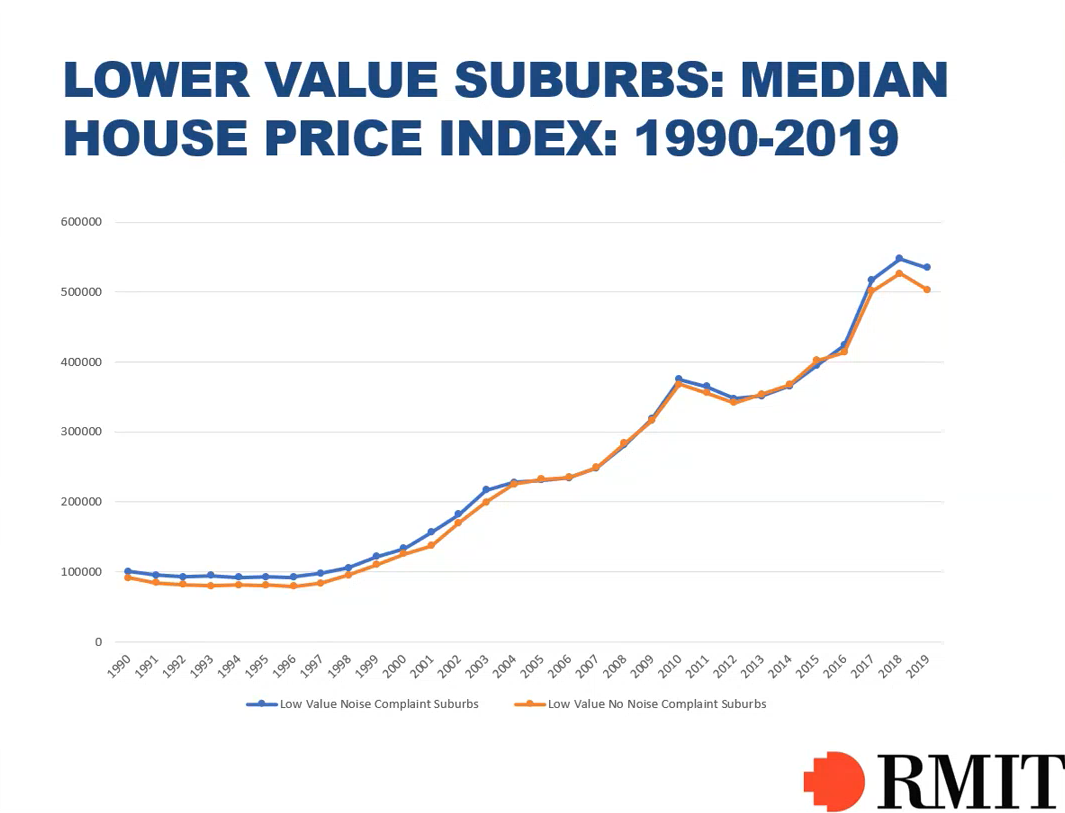
Graph showing the comparison of median price index from 1990-2019 for higher value suburbs, middle value suburbs and lower value suburbs on noise complaint versus no noise complaint
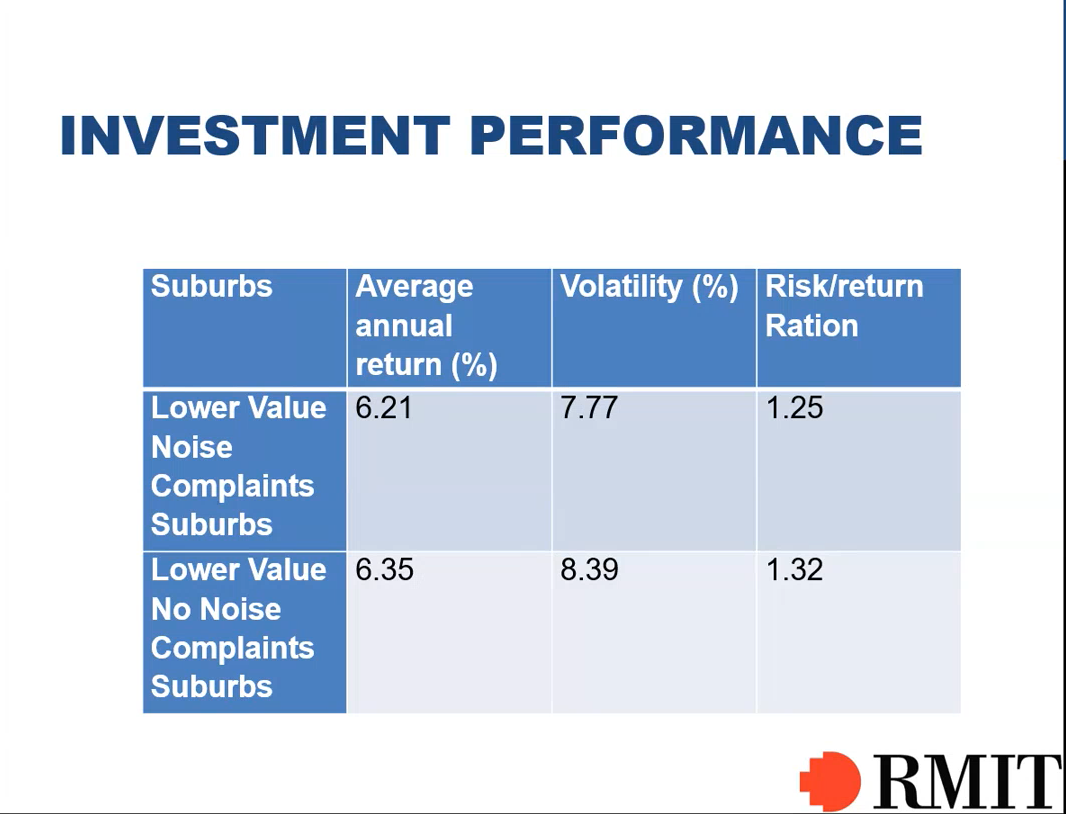
Prof Alfred showing the investment
performance of average annual return for higher value noise complaint
suburbs, middle value noise complaint suburbs and lower value noise
complaint suburbs
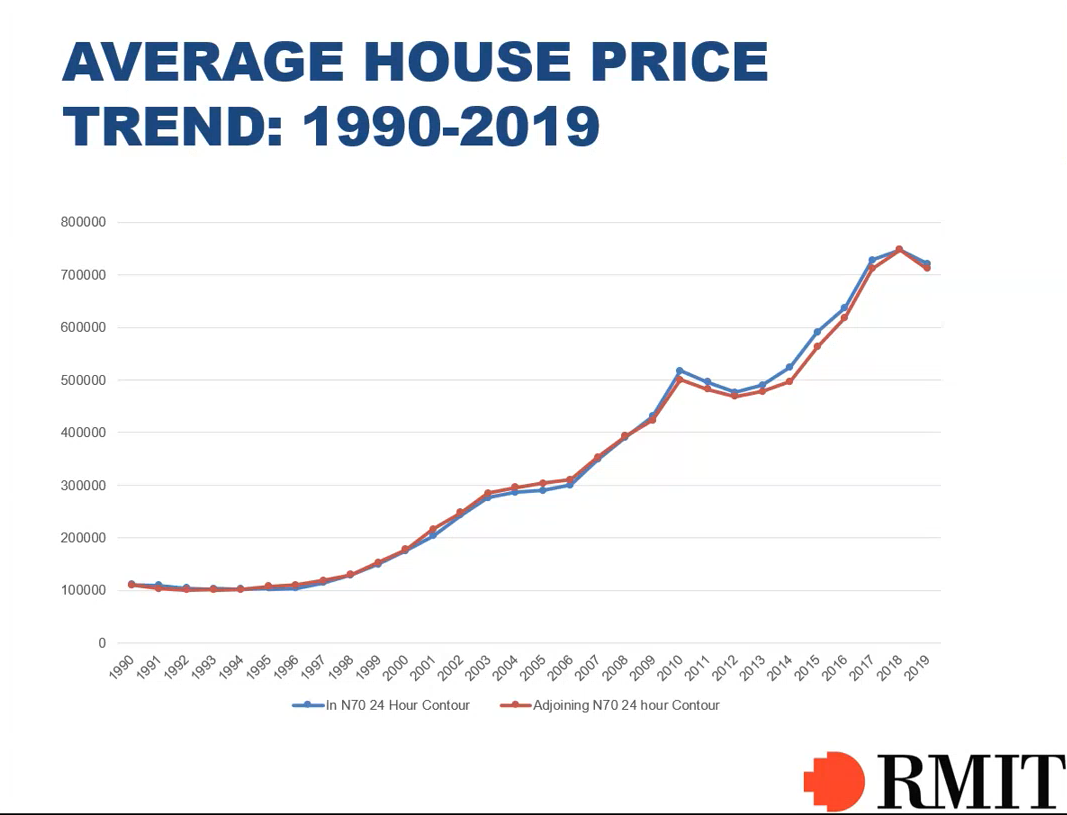
Graph presenting
average house price trend from 1990-2019 and the investment performance
comparison on N70 24-hour contour and adjoining N70 24-hour contour
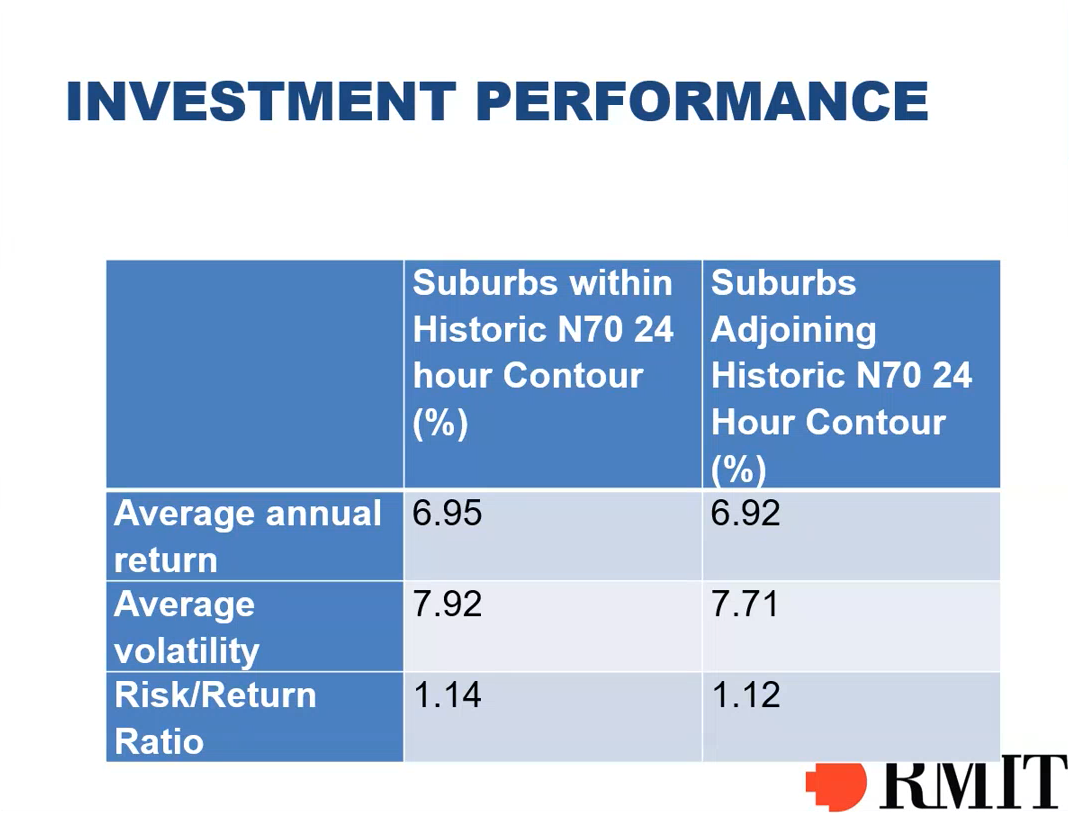
Prof Alfred said, “The trend of
the average house price sales and movement within the N70 24-hour contour
compared to the adjoining N70 24-hour contour is very similar, the average
annual return for suburbs within historic N70 24-hour contour is slightly
higher and outperformed than suburbs adjoining historic N70 24-hour contour.
Therefore, in this situation, we can conclude that the aircraft noise does
not have an impact on people making their purchase and investment decision.”
Nearing the end of the one-hour
talk, he shared about development potential, “Development potential is where
overlays come in. There are two overlays. The first one is Melbourne Airport
Environs that overlays one; it refers to the actual airport precinct itself.
The second one is Melbourne Airport Environs that overlay two covers. There
are a lot of the developments outside the airport precinct that takes in
quite a number of suburbs that have housing development that is subject to
the development of overlays.”
Prof Alfred concluded, “The trend
in the annual volume of sales had been very similar for the 36 suburbs
analyses on a noise complaint basis when the change in volume from year to
year is compared. It has also been confirmed that the length of
homeownership is not linked with aircraft noise with high noise impacted
suburbs in Melbourne. We see evidence that people who live near the airport
are quite happy to stay in that environment compared to being away from the
airport. It can be interpreted that locations in suburbs subject to aircraft
noise complaints will have minimal impact on the rate of sales compared to
non-affected property.”
He emphasised, “In Brisbane,
suburbs like Highgate Hill and Holland Park maintain strong price growth
through airport developments due to their renowned prestige, good schools
and proximity to the Sydney Central Business District, despite being near
the flight paths. It was found that the variation in median house price
trends and long-term investment performance reduced and still falls within
very tight ranges regardless of location and exposure to aircraft noise.
These very similar investment performance results again confirmed that the
residential property purchaser considers a range of factors when purchasing
and valuing houses. These factors include price, views, location to
services, distance to work and transport, reliability of transport,
recreational facilities, health facilities and schools, as well as negative
factors, such as road noise, aircraft noise, crime and poor environmental
factors.”
The one-hour discussion then saw
an active interaction between the speaker and the participants. The talk
concluded with an extensive yet insightful Q&A session.

A group photo at the end of the webinar
![]()
![]()
Wholly owned by UTAR Education Foundation Co. No. 578227-M LEGAL STATEMENT TERM OF USAGE PRIVACY NOTICE